VOL 2, ISSUE 2
Selecting a Biological Indicator with Appropriate Resistance Performance to Monitor a Validated Sterilization Cycle

By Garrett Krushefski, Laboratory Manager
Recently, a SterilAmp customer expressed their concern in using a lot with spore population of 1.3 X 10⁶ per ampoule and D121-value of 1.9 minutes. The labeled empirical (Fo) survival and kill times were 10.0 and 15.0 minutes, respectively. The calculated survival and kill times were 7.8 and 19.3 minutes. The validated sterilization cycle was developed to deliver 15.0 Fo. Their concern was the potential to observe a positive SterilAmp during annual revalidation. They felt that the BI resistance was too great for their existing validated cycle.
The Official Monographs in USP 27 state that biological indicators (BIs) used to monitor steam sterilization cycles shall have a viable spore count of 104 to 109 per carrier. The General Information Section <1035> of the same document states that a suitable steam BI should have a D121-value between 1.5 and 3.0 minutes. ISO 11138-3, EN 866-3 and EN 866-7 also state that the D121-value must not be less than 1.5 minutes.
The ISO and EN documents require a minimum population of 105 and state that the log10 of the nominal population multiplied by the D121-value shall not be less than 10.0.
Armed with the above information, proper selection of a steam BI should be simple, right? …Wrong.
Selection of a BI can be a relatively simple process if one understands that the function of the BI is to confirm the data being generated by physical measurements.1 In cases where thermocouples are not available for daily cycle monitoring, the BI is used as the sole indication of cycle lethality. Properly used, the BI challenge will demonstrate that the biological lethality will correspond to an Fµ value measured with calibrated thermocouples.2 Furthermore, “positive BIs are not indicative of process failure unless the log reduction data do not indicate a proper reduction for the lethality parameter established in cycle development,”3 a concept that will be discussed below.
[1] Technical Monograph No. 1, Validation of Steam Sterilization Cycles, PDA, Philadelphia, 1978.
[2] J.P. Agalloco, J.E. Akers and R.E. Madsen, “Moist Heat Sterilization – Myths and Realities,” PDA Journal of Pharmaceutical Science & Technology, Vol.52, No.6 / November-December 1998, p. 347.
[3] Ibid.
Properly developed sterilization cycles have been validated to deliver a specific lethal dose or F equivalent value. When the bioburden of the product being sterilized has been evaluated, the F value is determined based upon the amount of lethality necessary to inactivate the bioburden and provide the desired sterility assurance level. In the absence of bioburden analysis or when sterilizing items that are not susceptible to degradation by extended exposure to sterilization conditions, a common default assumption is to develop a cycle that will provide a 12-log reduction of a contaminant with D121-value of 1.0 minutes.
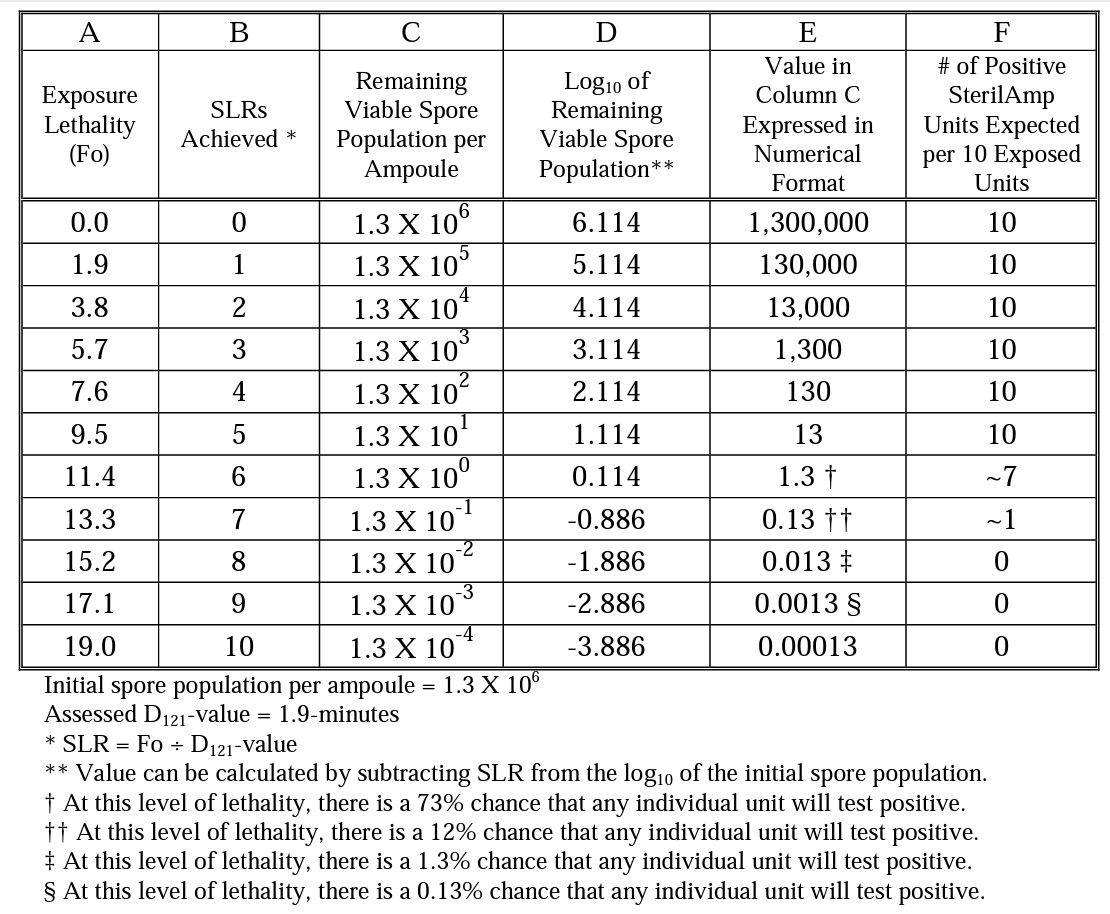
Using the SterilAmp resistance performance characteristics cited above, we can construct the following chart which outlines the death kinetics for the SterilAmp BI. By definition, one spore log reduction (SLR) of the viable spore population is achieved with each incremental exposure of 1.9 minutes at 121°C.

As stated above, the validated cycle was developed to deliver an F value of 15.0. This value is divided by the D121-value of 1.9-minutes to calculate the SLRs that will be rendered by 15.0 Fo. 15.0 ÷ 1.9 = 7.895 SLRs. The log10 of the initial 1.3 X 10⁶ spore population is 6.114. The achieved SLR is subtracted from 6.114 to yield -1.781 (6.114 – 7.895 = -1.781). The inverse log of -1.781 is 0.0166. Therefore, when exposed to 15.0 Fo, a SterilAmp unit with above cited resistance performance will have a spore population of 1.66 X 10⁻² .
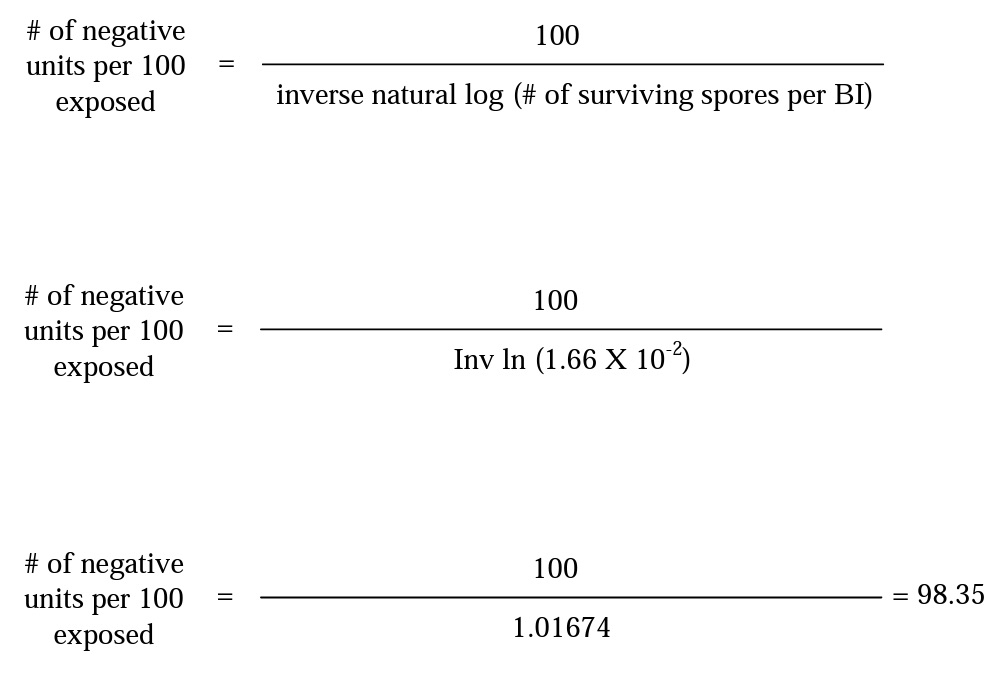
The following equation can be used to calculate the percentage that this particular unit will test positive.

Thus, with 98.35 BIs testing negative out of 100 exposed, there is a 1.65% chance for a growth-positive indicator; or for every 60 replicate BIs exposed, approximately one positive BI should be expected.
If the client were to use this lot of BIs during the annual revalidation, it is very likely that all of the exposed test units would be negative for growth. However, an occasional positive BI would not be indicative of cycle failure; rather, the BI is very accurately indicating the biological lethality observed and those results would very closely correlate with the 15.0 Fo being recorded by the thermocouples. On the contrary, if eight (8) positive units of the ten (10) exposed replicates per cycle were to test positive, that level of survival would indicate cycle failure. Referring to the above Table, one can see that an 80% survival rate would indicate a cycle lethality of slightly less than 11.4 Fo.
With a BI survival rate of 80% the above equation can be used to calculate the average number of surviving spores per BI:
20 negatives per 100 exposed BIs = 100 / Inv ln (# of surviving spores per BI)
5 = Inv ln (# of surviving spores per BI)
ln 5 = 1.609 surviving spores per BI
The log10 1.609 = 0.207 and this value is used to calculate SLRs associated with an 80% BI survival rate:
6.114 – SLRs = 0.207
SLRs = 5.907
Finally, multiply the 5.907 SLRs × 1.9-minute D121-value = 11.22 Fo.
In this case, the 80% BI survival rate is indicating a delivery of only 11.22 Fo. As this value is less than the 15.0 Fo that should be delivered in the validated cycle, one would conclude cycle failure.
The above example illustrates how a positive BI is not always indicative of cycle failure. When using BIs there are three potential outcomes:
- all BIs test positive,
- all BIs test negative,
- fractional results are obtained (i.e. some positive, some negative units).
Most BI users assume that condition #2 must be met to demonstrate cycle acceptability/lethality. In fact, the most accurate and valuable information is rendered when fractional results are obtained. When conditions # 1 or 2 are met, one knows only that the lethality was either less than the expected value or greater than the acceptable value, without having any indication of the exact lethality delivered during the process. When condition #3 prevails, very specific lethality information is obtained and the biological results provide a precise indication of the lethality for the process.