
By Laurent Berliet and Silvia Rizzi
For heat-sensitive products and low F0 cycles, the Biological Indicator/ Bioburden method is preferred with the possibility of using liquid submersible biological indicators (LSBIs) such as ProSpore®, MagnaAmp® or SterilAmp® inoculated with a lower population (104) of Geobacillus stearothermophilus, or SterilAmp inoculated with Bacillus subtilis 5230, a less resistant organism.
When the characteristics of the product may be degraded by the overkill sterilization processes, time and temperature parameters must be reassessed so as not to affect the quality of the product.
In these cases, the validation approach is based on the Biological Indicator/Bioburden method. This approach requires appropriate knowledge of the product bioburden and product-related D-values in conjunction with BIs of lower spore count or lower resistance to ensure sterilization (USP <1229.2>). The method relies on substantial differences between moist heat resistance and population of the bioburden present in comparison to the biological indicator used during
validation (Figure 1).
In this approach G. stearothermophilus can be used with lower populations (not < 10³); however, B. subtilis 5230 with a population of 106 and a lower resistance than G.stearothermophilus is preferred as outlined in ISO 11138-3 and the USP. Bacillus subtilis 5230 remains one of the most resistant strains to steam sterilization known while still allowing a significant reduction to the applied cycle to reach a sterility assurance level (SAL) of 10-6. This method requires control of the bioburden, identification of bioburden isolates, and resistance testing (D-value study) of the spore-forming organisms, to guarantee that they are less resistant than B. subtilis 5230 used as the test microorganism (Figure 1).
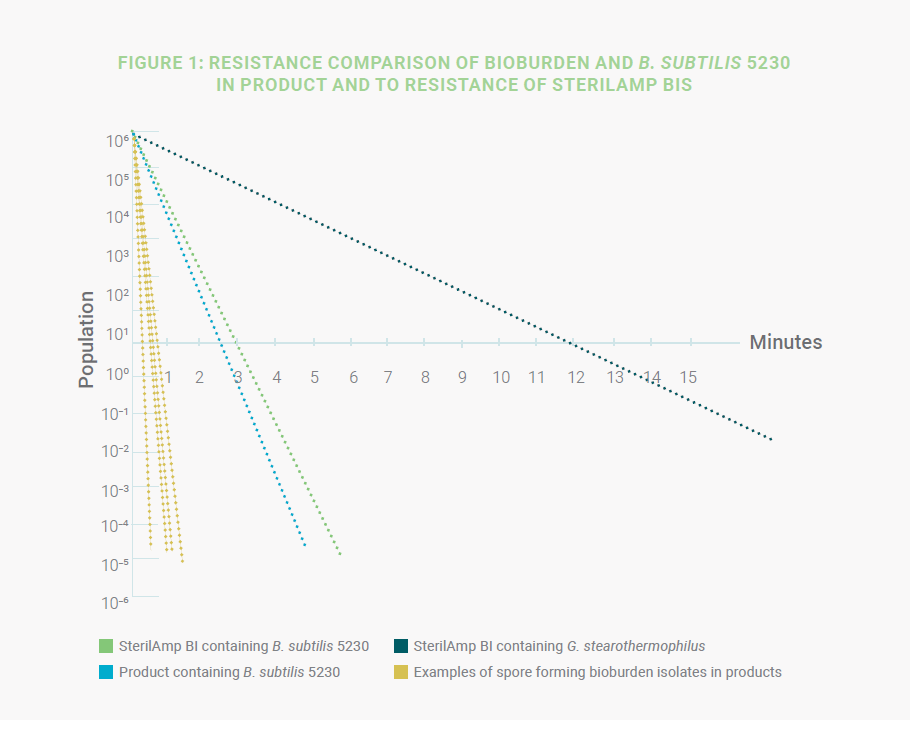
In the above graphics, the survival curves of four product bioburden isolates are compared with B. subtilis 5230 for
thermal resistance under the same conditions. In this case, B. subtilis exhibits significantly higher resistance than the
bioburden organisms and can therefore be used as the test microorganism to challenge the sterilization process. Since
the product can have varying effects on the spores (increasing, decreasing, or no impact on the resistance), the next step
is to evaluate the resistance of the B. subtilis in the product before choosing a BI for validation. This is accomplished by
conducting a product D-value study with B. subtilis inoculated into the product.
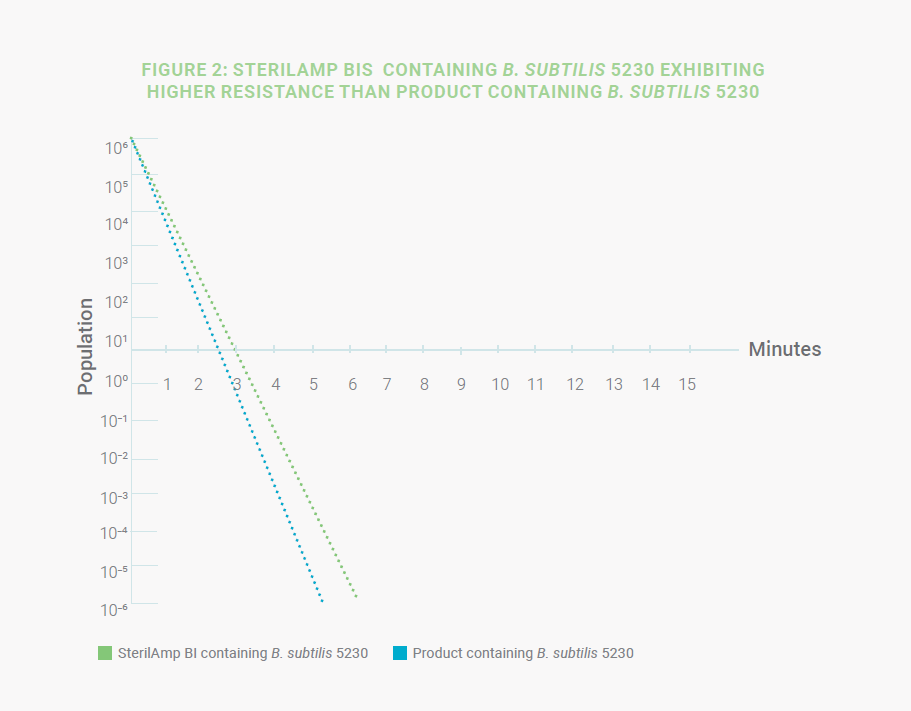
In this first example, the use of the standard SterilAmp BI inoculated with B. subtilis 5230 is appropriate when the D-value
stated on the CoA is equal to or greater than the D-value of the microorganism when tested directly in the product, thus
providing a suitable challenge to guarantee acceptable SAL on the sterilized product (Figure 2).
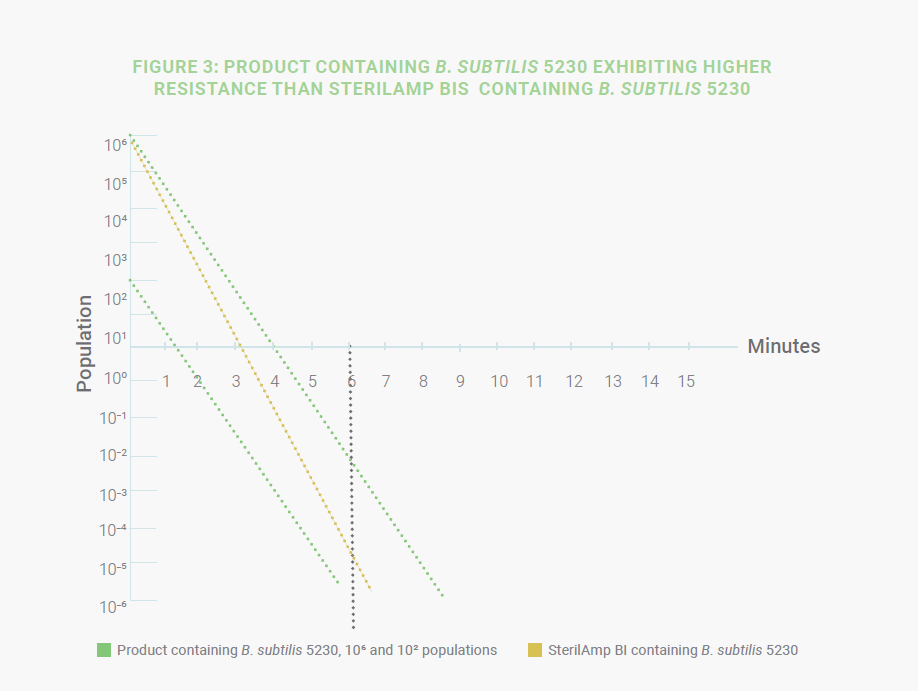
Another possibility is if the D-value of the B. subtilis in the product is higher than the D-value of a B. subtilis SterilAmp
then the BI does not represent the worst-case scenario. (Figure 3) This increased resistance could be a result of the
product causing the spores to clump or become coated as explained in Spore News – Product D-value Studies: a Critical
Tool When Developing a Sterilization Process.
Sometimes, the answer is not that simple. Contrary to most aqueous products whose impact on lethality does not affect
the linearity of microbial death kinetics, D-value studies on gels or other products whose texture can be modified during
sterilization can show a bi-phasic lethality. The origin of this biphasic lethality remains difficult to determine, due to
aggregates or changes in the rheological properties of the product (such as cross-linking of polymers, etc.).
When a D-value study is carried out starting with 106 spores of a test organism, it is possible to get non-linear results.
An example of this phenomenon is where there are two different slopes characterizing the spore’s destruction: the first
slope, higher destruction (lower D-value), during the beginning of exposure, and a second phase with lower destruction
(higher D-value) later during exposure. The higher resistance of the second phase is correlated to the longer exposure
times needed to destroy the last logs of the inoculated population. (Figure 4).
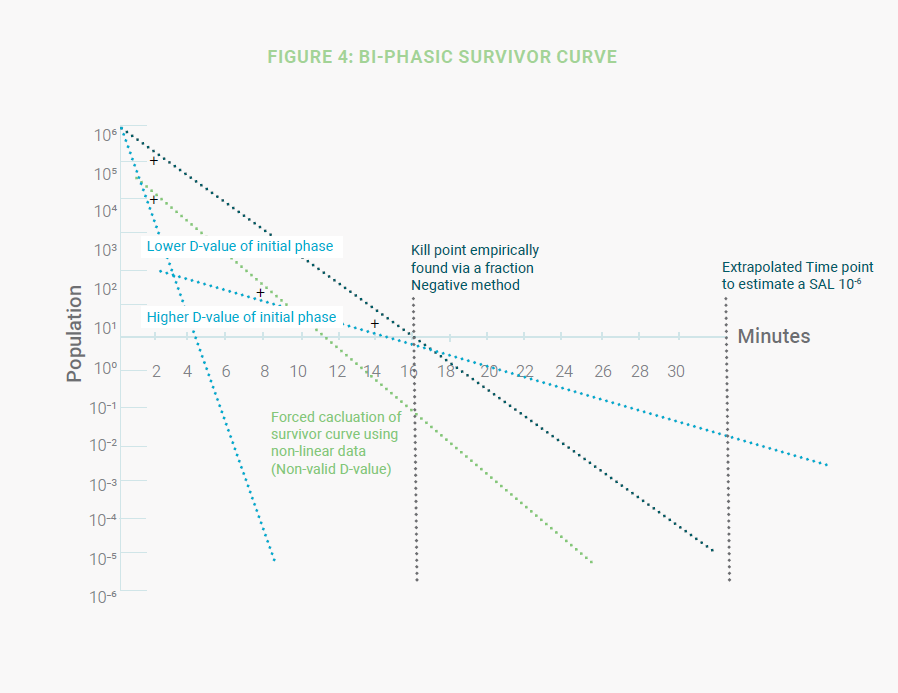
When a product D-value study results in a bi-phasic curve, the solution becomes more complex. A “D-value” calculation
can be forced, but an accurate SAL cannot be extrapolated from non-linear data. The standards do not address these
situations. One possible approach is to empirically find and confirm the kill point via a Fraction Negative method which
identifies the time frame when a minimum of a six-spore log reduction (SLR) is achieved. This time point can then be
doubled to estimate a SAL of 10-6. This approach could be applied to any non-linear death kinetics.
Sterilization and microbiological validation of heat-sensitive products require an understanding of the product’s thermal
behavior when heat treated. In addition to understanding the product’s effect on the resistance of spores in relation to the
BI used to monitor the cycle, there are many other items that need to be considered during product cycle development
including packaging material and configuration, or other parameters that may need to be calculated (e.g., z-value).
These considerations will help execute a consistent D-value study to develop a robust validation.