
By Garrett Krushefski & updated by Mesa Staff
The point of this Spore News is to help you prepare your purchase specifications based on sound science. First, let us consider the spore population label claim verification testing. USP and ISO state that recovery values within 50% to 300% of the label claim are acceptable. This may seem like a HUGE range (1.0 x 10⁶ to 6.0 x 10⁶ for a BI lot with a 2.0 x 10⁶ population) until one considers the overall insignificant impact this has on the resistance performance for the indicator. Table 1 outlines the spore death kinetics for three theoretical BI lots with spore populations of 1 million, 2 million, and 6 million spores per BI. Each lot has a 4.0-minute D EO -value.
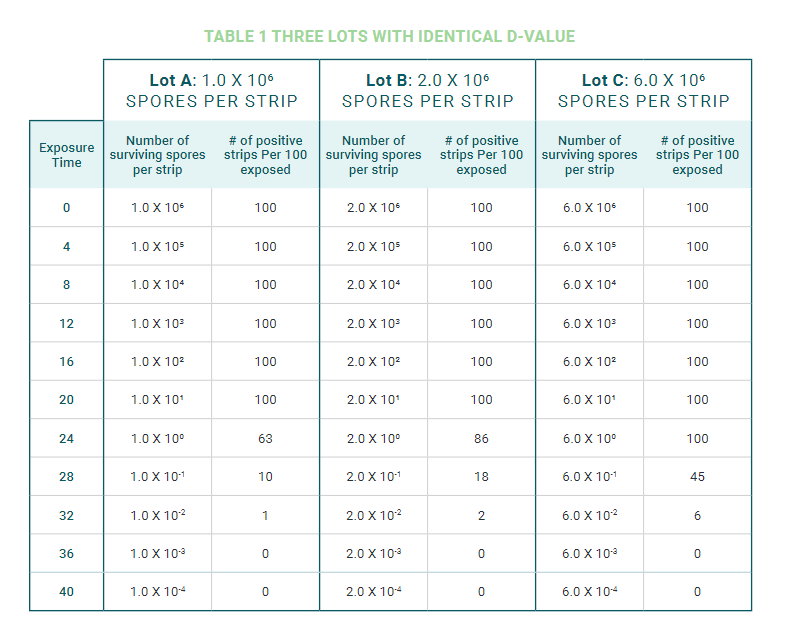
Note that despite the number of spores present on each strip, all 100 test strips from each of the three lots would be killed in the 36.0-minute
exposure. At all shorter exposures, positives would be observed. From a user standpoint, any of the three lots could be used to monitor a
sterilization cycle and virtually no difference would be detected. The subtle differences in the number of positive units as shown in this table
could only be detected in a resistometer used by the manufacturer to determine the BI lot D-value. Resistometers are designed to deliver
tightly controlled, distinct “doses” of lethality.
The Calculations
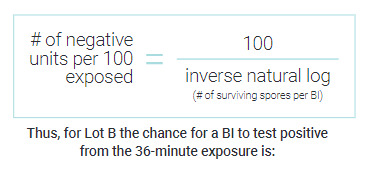
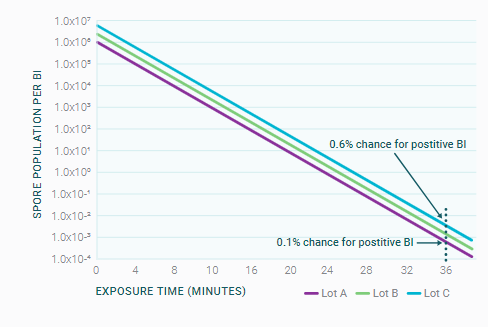
While zero positives are expected for any of the lots when exposing 100 strips in the 36-minute cycle, we can calculate the percent chance for survival using the following equation.
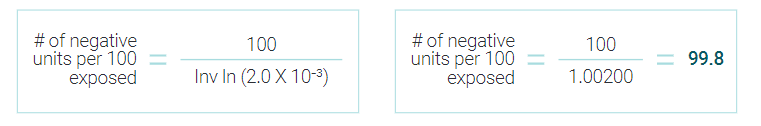
Thus, one will have 99.8 negative units per 100 exposed; or a 0.2 % chance for any individual strip from Lot B to test
positive after having been exposed to the 36-minute exposure.
For Lot A, there is a 0.1% chance for a positive BI from the 36-minute exposure. For Lot C, there is a 0.6% chance for a
positive BI from the 36-minute exposure.
We now see how the seemingly large difference in 1 million or 6 million spores per BI is reduced to an insignificant
difference in potential for survival.
THE FOLLOWING IS A GRAPHICAL REPRESENTATION OF THE RELEVANT SPORE DEATH KINETICS.
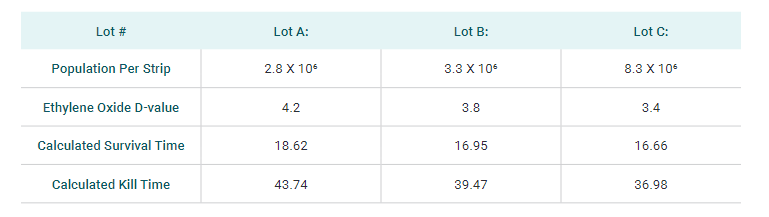
All the above discussion was based upon theoretical BIs. Let us now look at three actual lots of MesaStrip to see how difficult they are to kill.
The spore population for Lot A is 2.8 X 10⁶, DEO-value = 4.2 minutes.
The spore population for Lot B is 3.3 X 10⁶, DEO-value = 3.8 minutes.
The spore population for Lot C is 8.3 X 10⁶, DEO-value = 3.4 minutes.
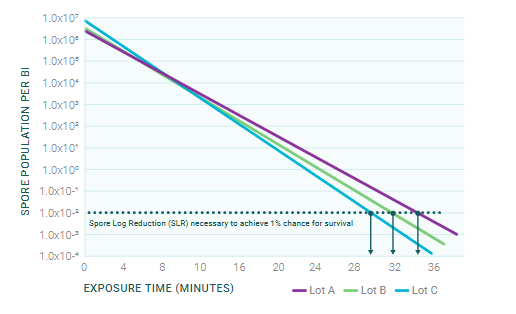
So, which lot will be the easiest to kill? The answer may surprise you.
The answer... Lot C with its 8.3-million spores is the easiest to kill!
TABLE 2 COMPARISON OF RESISTANCE PERFORMANCE FOR THREE LOTS
The graph below presents the log-linear death curve for each lot from Table 2. Examination of the graph helps to illustrate how it is possible that a strip with more than twice as many spores as either of the other two will be inactivated first.
The purchase specification is intended to secure a product that will provide you with a consistent challenge for monitoring your sterilization process. Performance is the key and spore population is one element that influences it, but only one. Like a jigsaw puzzle, you cannot see the whole picture by focusing on one piece. Spore population on the BI is only one piece of the sterilization puzzle.