VOL 5, ISSUE 5
The Most Important Letter in SteriliZation is Z
By Garrett Krushefski, Scientific & Technical Services Manager, & John R. Gillis, Ph.D.
The Z-value is one of the most important expressions of resistance of your biological indicator (BI). Many users of BIs appear to be uncomfortable about applying this value to the evaluation of the sterilizer process lethality. Sterilization is a complicated process and applying the Z-value appears to complicate things even further. Hopefully this Spore News will help clear up some confusion and misunderstanding regarding Z-values.
Previous issues of Spore News have discussed how to calculate Z-value (Volume 3, Number 2) and how to use the Z-value to calculate D-values and kill times at test conditions not reported on the Certificate of Analysis (Volume 3, Number 1). This issue of Spore News will focus on how one uses the Z-value to determine the total lethality delivered in a sterilization process.
The ISO definition of Z-value is “the change in exposure temperature of a thermal sterilization process which corresponds to a tenfold change in D-value.” The ISO definition of a D-value is “the time required to achieve inactivation of 90% of a population of the test organism under stated dose conditions.” To illustrate this aspect, consider a steam BI with D121°C-value of 2.0 minutes and Z-value of 10.0°C.
- At 131°C (i.e. 121°C + 10°C = 131°C) the D-value would be 0.2 minutes.
- At 111°C (i.e. 121°C – 10°C = 111°C) the D-value would be 20.0 minutes.
When sterilizing with steam or dry heat, there are three general phases of the cycle in which lethality is delivered to the bioburden on the product and the spores in the BI. These phases are the heat-up, exposure dwell time, and come-down (or exhaust) phases. During the heat-up portion of the sterilization process, prevailing temperatures are, by definition, below the target exposure temperature. During the exposure dwell time, temperatures are typically equal to or greater than the target condition. The come down time phase temperatures are, by definition, below the stated process temperature. When sterilizing solid goods, the come down phase may be very rapid. However, when sterilizing liquids, the come down phase is usually controlled to allow the liquid products to slowly cool as chamber pressure slowly approaches atmospheric levels. This controlled cooling/pressure drop is essential to keep the liquid product from “boiling-out” or packaging material from bursting due to too great of a pressure differential. A substantial amount of thermal lethality may be delivered to the product during the heat-up and the slow, controlled come down phases.
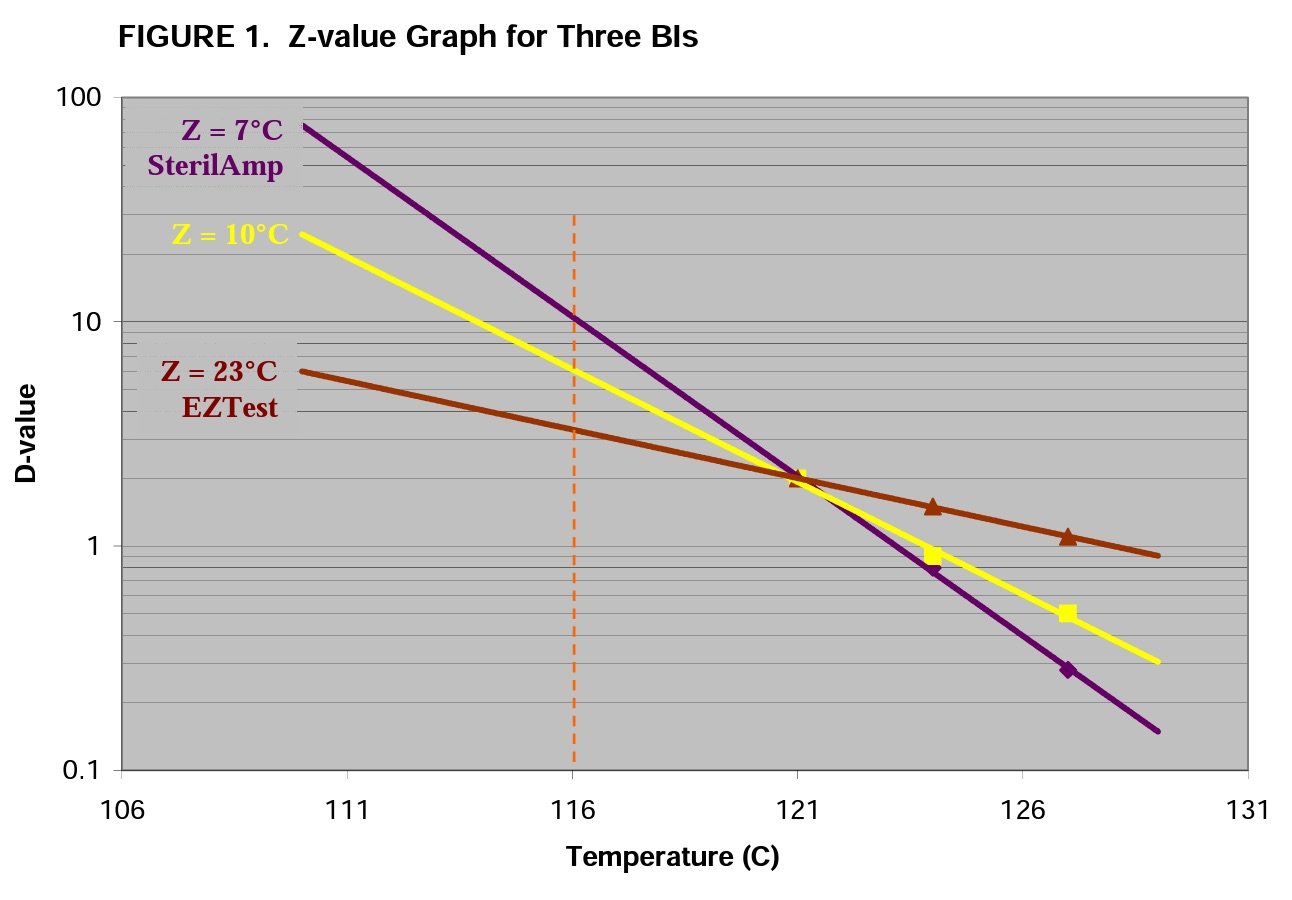
The graph in Figure 1 shows three hypothetical BIs, all with D121°C-value of 2.0 minutes. In literature a Z-value of exactly 10.0°C is often referenced for steam processes. This is represented by the yellow line in Figure 1. However, when purchasing BIs, the actual Zvalue will rarely be exactly 10.0°C. Liquid submersible indicators such as SterilAmp and MagnaAmp usually have Z-values between 7 – 10°C (purple line). The self-contained EZTest, by virtue of product design and primary packaging materials, can have a Z-value in excess of 20°C (brown line).
This graph helps to visualize an extremely important aspect of the Z-value. As stated previously, the prevailing temperatures will be below the target temperature (i.e. 121°C in this example) during heat-up and come-down phases of the sterilization cycle. If one were using the EZTest BI with 23°C Z-value, the D-value while at 116°C is ~3.3 minutes. If the SterilAmp BI with Z-value of 7°C were being used, the D-value at 116°C is ~10.5 minutes. When heat penetration studies are performed with calibrated thermocouples, we often program the data collecting device to calculate and accumulate F0 lethality. To do this, the lethality equation is programmed with a Z-value of 10.0°C. Thus, the thermocouples with Z-value entry of 10.0°C will calculate lethality as though the D-value at 116°C was 6.1 minutes. This will result in a physical measured lethality (thermocouple reading) that will be different from the biological measured lethality (spores in the BI).
Thus, when the sterilization process is at temperatures below the reference temperature (121°C), the BI with the low Z-value requires more time to achieve the spore lethality. The opposite is true at process temperatures above 121°C in which case the BI with low Z-value requires less time to achieve the spore lethality.
Consider this…during a sterilization cycle the product is almost NEVER at exactly 121°C. Even during the exposure dwell time, one will experience fluctuations within the accepted temperature range established during cycle validation (i.e. -0°, +2°C). The D-value is a very accurate estimate of lethality at a very specific temperature; plus or minus 0.5°C has a substantial impact. As a discrete value, the D-value has little relevance to the users as this very specific condition within the cycle will almost NEVER occur. Never the less, our Customer Service personnel are constantly met with requests for a specific D121°C value and have customers reject a particular lot because the D-value on the Certificate may be 0.1 to 0.2 minutes different from their perceived “ideal value”. Unfortunately, this “ideal value” is one that has been added to a purchase specification or other controlled document by someone who truly did not understand the sterilization process. So to avoid the ordeal of a document change, we continue to perpetuate poor decisions.
Now that we’ve illustrated the impact of Z-value on the ability to kill spores, let us consider how to use the Z-value to properly calculate total cycle lethality. We must remember that the spores are integrating the variable lethal rates even if we choose not to.
Figure 2 shows a cycle temperature graph for sterilization of 1800 ml of a liquid product in 2000 ml containers. The red line denotes chamber temperature while the blue line shows the product temperature recorded by penetration thermocouples. This illustrates the lag-time-to-temperature (which will be longer as product volume or mass increases) and shows why liquid-submersible BIs must be submerged into product samples when properly used in monitoring sterilization of liquid loads.
In this example, the sterilizer is set to operate at 121°C with a tolerance of -0° to +2°C. The chamber is relatively quick to achieve this condition whereas the 1800 ml liquid product lags behind based on the laws of mass action and heat transfer characteristics of the goods being heated.
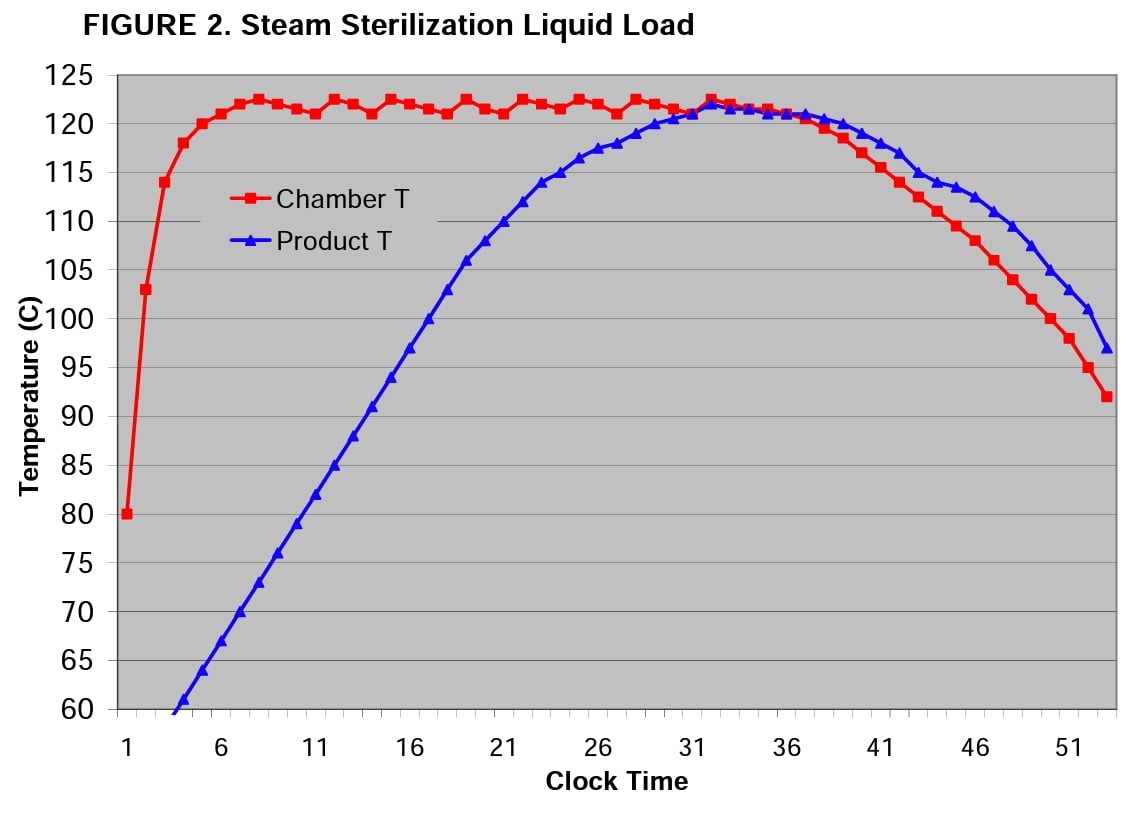
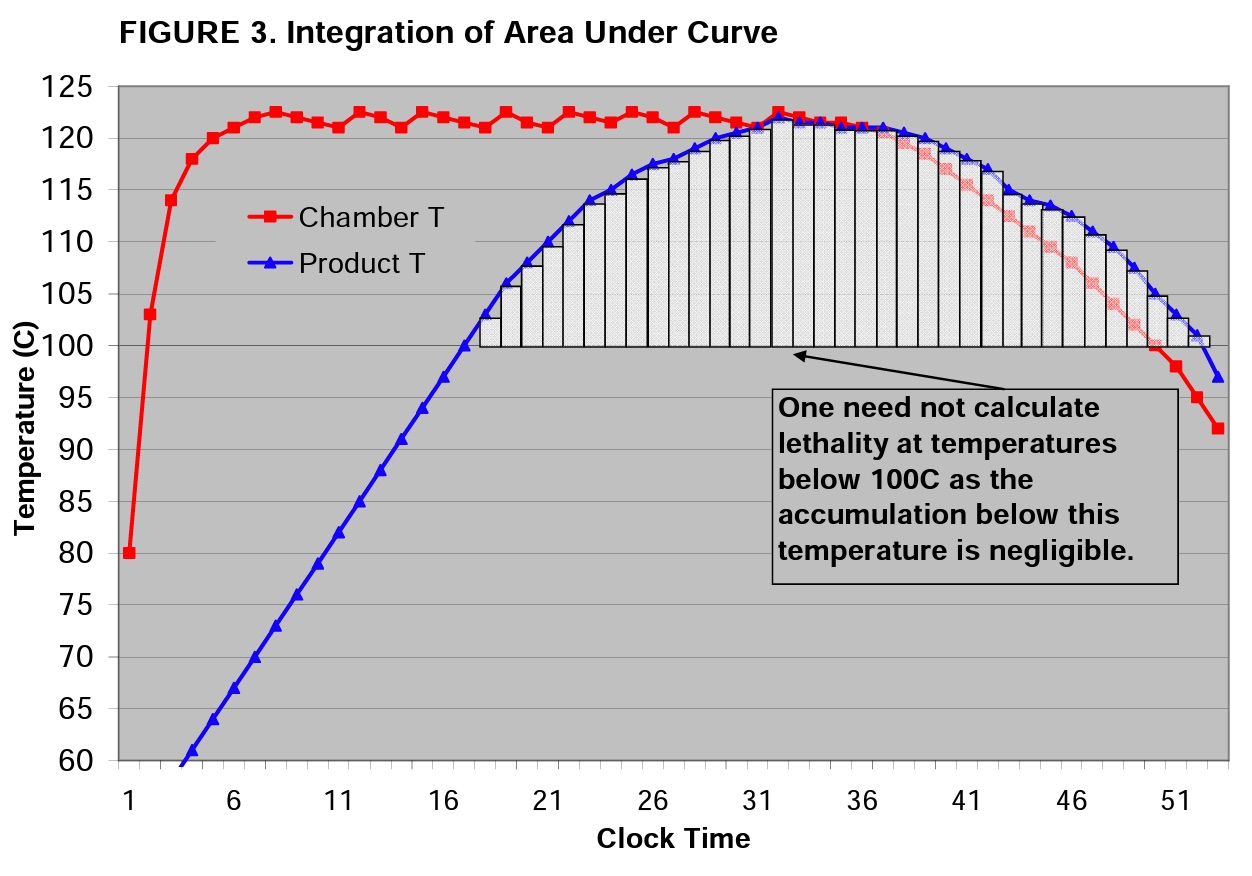
Note that the cycle above has a 53 minute clock time from start of the cycle to door open. The exposure phase of the cycle runs from clock time of 5 to 35 minutes, but the product does not reach 121°C until clock time of 30 minutes. To calculate the lethality delivered to the product, one must integrate the area under the product curve (blue line).
Correct application of the Z-value allows one to account for all of the lethality delivered during the entire process (i.e. “process lethality” or “process equivalent time”). This task is performed by integrating the area under the curve. To do so, one must break the curve into portions; the smaller the portion, the more accurate the end result will be. For the illustration in Figure 3, a 60 second interval is used creating 35 segments.
The next step is to determine the lethality value for each segment using the following equation:

As an example, we’ll consider the seventh segment where the product temperature reading is 115°C, the segment clock time is 1 minute and Z-value = 7.0°C.


Thus, that one minute clock time interval has a process lethality value of 0.14 F. Repeat this calculation for Z = 10.0 and Z = 23.0 to find the following results.
TABLE 1. Lethality Value for 60 seconds at 115 °C
| Z-Value | Lethality Value |
| 7.0°C | 0.14 F |
| 10.0°C | 0.25 F0 |
| 23.0°C | 0.55 F |
Note that when Z = 10.0°C and the reference temperature = 121°C we can denote the lethality as F0. For all other Z-values the symbol to denote lethality is simply F or FT,Z where T = any reference temperature and Z = specific Z-value.
To calculate the total cycle lethality, one must calculate the value for each segment of the cycle curve. Table 2 shows the lethality value for each of the thirty-five segments from left to right and the Total Lethality for the cycle.
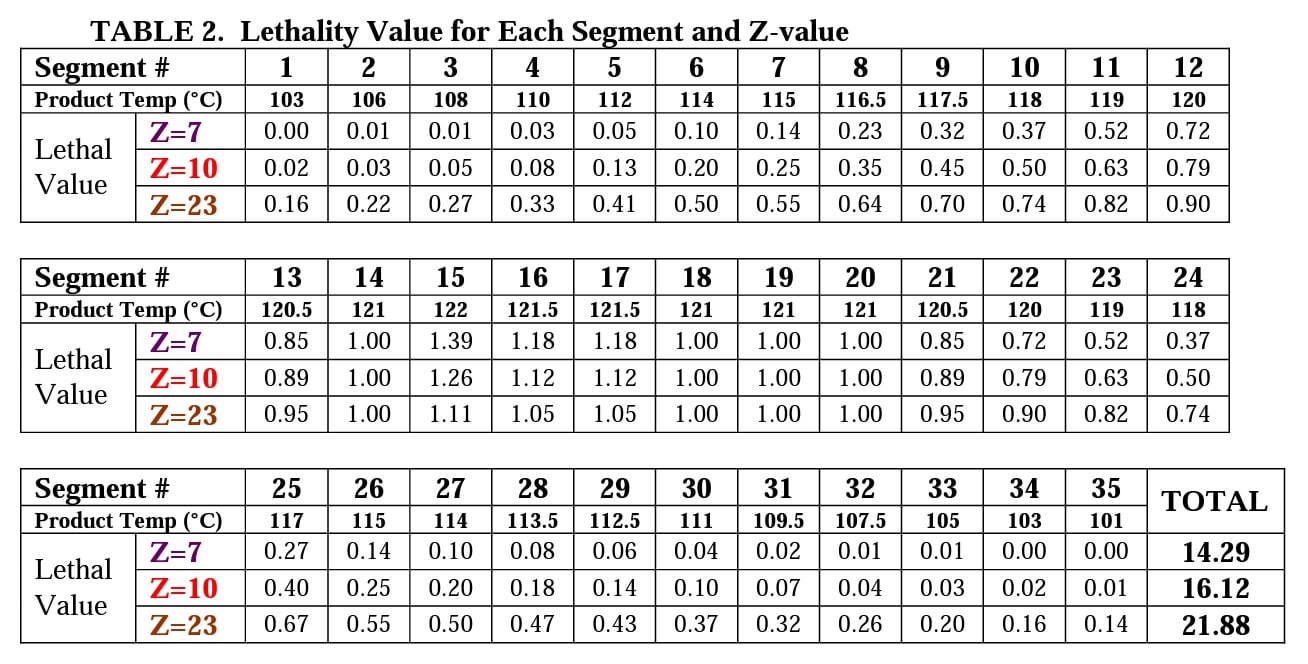
One can see that the actual process lethality delivered is quite variable depending upon the Z-value of the BI and why it is important to program your data collection instrument with the Z-value for the BI being used. In this liquid load example, the MagnaAmp BI has a D121°C-value of 2.0-minutes and Z-value of 7.0°C. Thus, we have a process lethality that resulted in 7.15 SLRs (spore log reductions) to the spore population of the MagnaAmp BI in that 14.29 F ÷ 2.0 D = 7.15 SLRs. If we don’t properly apply the Certificate of Analysis values for both D and Z-values, we are certain to have “unexpected” positive BIs.
If the data acquisition device is programmed with the default Z-value of 10.0°C, the total cycle lethality would be 16.12 F0, and one would wrongly believe that the SLRs achieved was 16.12 ÷ 2.0 D = 8.06 SLR.
The purpose of a biological indicator is to provide biological measurement of the physical lethality delivered by the process. If two different scales are used or two different systems, there is no way to get the confirmation one should expect. In a Commentary that appeared in the PDA Journal of Pharmaceutical Science & Technology (Nov-Dec 1998) J. Agalloco writes, “Each of us has encountered situations where the F0 measured by thermocouples positioned in the load is some substantial number, say 30, while at the same time one or more of the BIs placed in that same load have survived the cycle. We have also witnessed the reverse, in which an F0 value of perhaps 2-4 is determined with all of the BIs inactivated.” In such circumstances, the biological result does NOT confirm the physical data, the load is rejected and an investigation ensues. This is the point at which the seasoned reader of Spore News should find themselves thinking, “Spores Don’t Lie!”
It is prudent to use F0 (i.e. Z = 10°C) for cycle development as this provides a standard set of reference conditions which are well accepted. It is a standard that must be mathematically applied to our evaluation of the “real life” conditions that exist in product bioburden and biological monitors. The F0 value originated from the food industry and was related to a specific spore forming bacterial species, Clostridium botulinum, in a very specific low acid food product environment. It is extremely unlikely in the manufacture of sterile pharmaceutical or medical products that a naturally occurring bioburden organism would be killed at the exact rates predicted by F0 values.
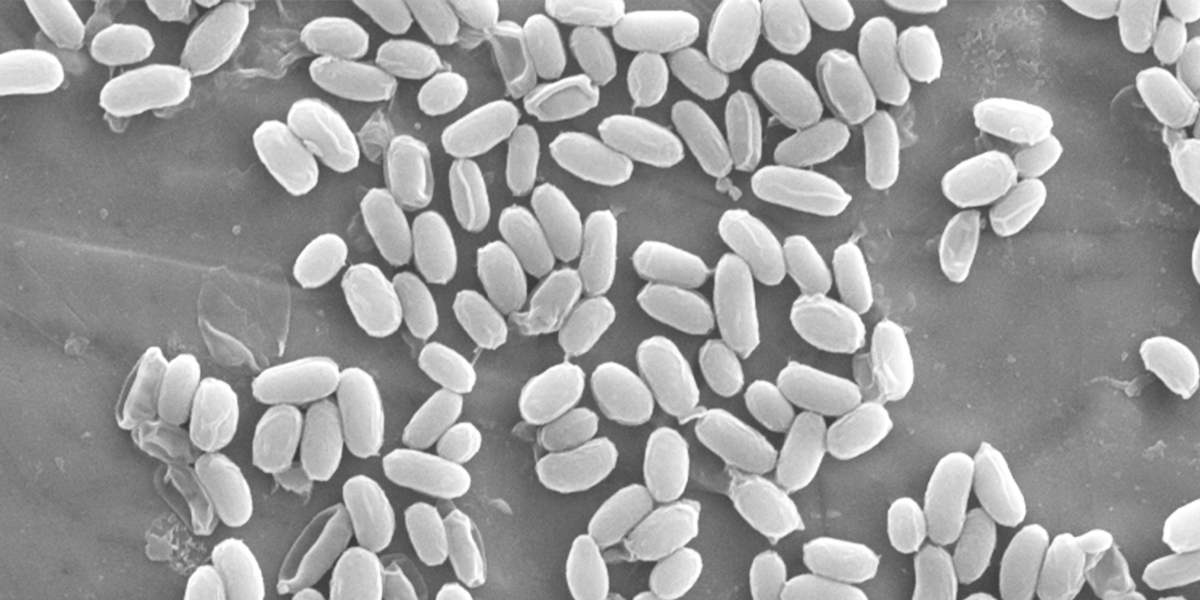
One should recognize that a wide spectrum of bioburden organisms as well as an infinite spectrum of products exist in the pharmaceutical and medical products industry. It is well understood that spores used in commercial BIs that comply with today’s recognized standards, ISO, EN, AAMI, USP, etc. are natural isolates of spore formers that have been demonstrated to be very resistant to a particular sterilization process, not C. botulinum. Therefore, we must apply the mathematical measurements determined for these organisms, the specific environments and the specific processes. Only through application of the Z-value for a particular biological challenge can one accurately predict the biological lethality delivered by the accurately measured physical process.
The purpose of the BI is to provide an accurate biological confirmation of the physically generated data. One must not make the mistake of neglecting to program the Z-value for the thermocouples to match your BI challenge. Failure to do so will result in thermocouples reporting a lethality value different from that which the spores are sensing. This leads to conflicting physical/biological results. The spores are always the messenger. When they survive a process for which the physical data indicates they should have been killed, the tendency is almost always to believe the physical data and attempt to discredit the biological data. The truth is that the spores are very predictable if the correct physical data is produced. The spore is the only tool available that can accurately integrate every critical process variable, known or unknown. If the spores survive the sterilization process, the process did not deliver sufficient physical lethality to kill them. Spores don’t lie!
